

New Delhi (ABC Live): The Performance Grading Index 2.0 for States and Union Territories 2025–26 gives India a detailed view of school education performance. Instead of treating it as a simple scorecard, policymakers should treat it as a reform map. It shows progress in access, equity and teacher-related indicators; however, it also exposes weak classroom learning across many States and Union Territories.
According to the report, PGI helps States and Union Territories identify strengths, gaps and priority policy areas in line with the National Education Policy 2020 and the Sustainable Development Goals. Moreover, India’s school system covers more than 14.67 lakh schools, 1.03 crore teachers and nearly 24.72 crore students. Therefore, a common assessment framework helps compare State-level performance in a clearer way.
Recent release-context reporting also confirms that the Union Ministry of Education released PGI 2.0 for States/UTs and districts for 2025–26 along with UDISE+ 2025–26. Meanwhile, media reports noted that the Learning Outcomes domain continued to rely on PARAKH Rashtriya Sarvekshan 2024 data, which makes classroom-learning interpretation especially important.
Key Points
- No State or Union Territory reached Utkarsh, Uttam-1 or Uttam-2 overall.
- Chandigarh alone reached Uttam-3, with a score of 766.0.
- Meghalaya remained the lowest performer with 525.7, although it improved from 448.0.
- Meanwhile, the inter-State gap reduced from 51% in 2017–18 to 31.4% in 2025–26.
- However, Learning Outcomes remain the weakest strategic domain.
- By contrast, Access, Equity and Teacher Education & Training show stronger performance.
- Therefore, PGI 2.0 should guide targeted reforms rather than serve as a success certificate.
Why This Critical Analysis Is Needed
PGI 2.0 matters because it converts a complex school education system into a common grading structure. However, the report reveals a major contradiction. India performs better in access, equity and teacher-related indicators, yet classroom learning remains weak.
This distinction matters because schooling does not automatically mean learning. A child may enter school, continue to the next class and complete a level. Nevertheless, the same child may still struggle with grade-level language, mathematics, science or social science. For this reason, the next phase of school education reform must focus on learning quality, not only attendance, infrastructure and administrative reporting.
PGI 2.0 Framework
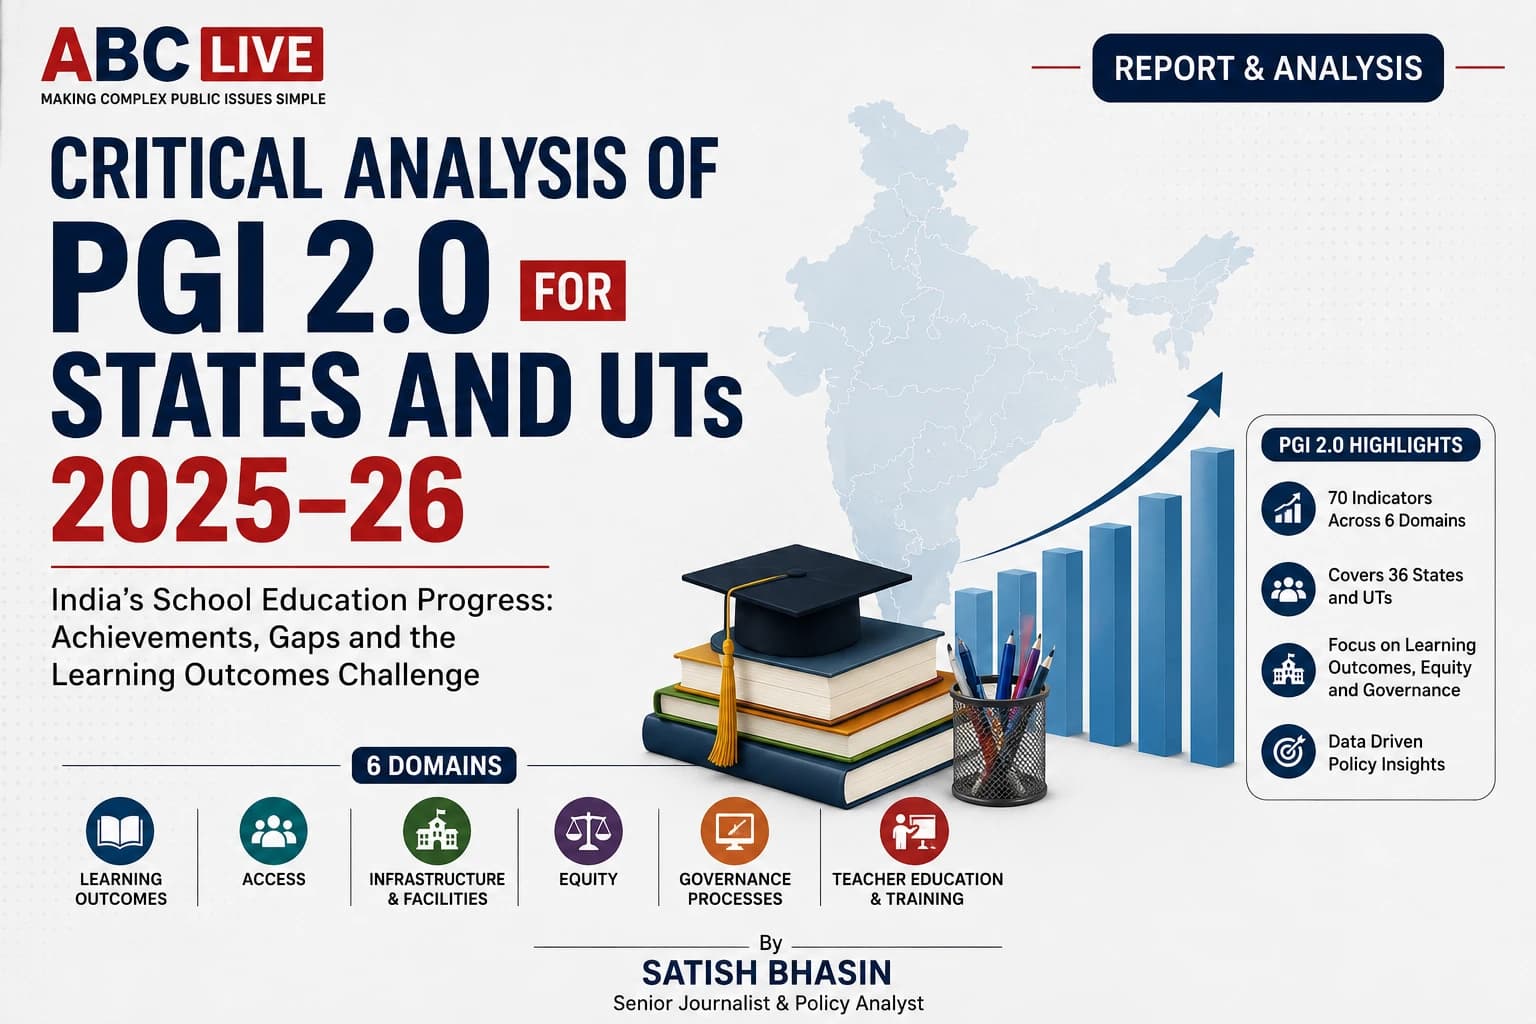
PGI 2.0 uses 70 indicators across two broad categories: Outcomes and Governance & Management. The framework covers six domains: Learning Outcomes and Quality, Access, Infrastructure & Facilities, Equity, Governance Processes and Teacher Education & Training. In addition, the report draws data from UDISE+, PARAKH Rashtriya Sarvekshan 2024, PM POSHAN, PRABANDH and Vidyanjali.
Table 1: PGI 2.0 Framework
| Domain | Weight |
|---|---|
| Learning Outcomes | 240 |
| Access | 80 |
| Infrastructure | 190 |
| Equity | 260 |
| Governance | 130 |
| Teacher Training | 100 |
| Total | 1000 |
Notably, the report gives 600 out of 1000 points to Learning Outcomes, Equity and Teacher Education & Training combined. Therefore, PGI 2.0 does not only measure school buildings or administrative compliance. It also tries to capture education quality, inclusion and teacher readiness.
Overall PGI 2.0 Grade Distribution
The most important finding is clear. The best overall grade achieved in 2025–26 is only Uttam-3. Notably, no State or Union Territory reached Utkarsh, Uttam-1 or Uttam-2.
Table 2: Overall Grade Count
| Grade | Score Range | Count |
|---|---|---|
| Utkarsh | 941–1000 | 0 |
| Uttam-1 | 881–940 | 0 |
| Uttam-2 | 821–880 | 0 |
| Uttam-3 | 761–820 | 1 |
| Prachesta-1 | 701–760 | 4 |
| Prachesta-2 | 641–700 | 5 |
| Prachesta-3 | 581–640 | 13 |
| Akanshi-1 | 521–580 | 13 |
| Akanshi-2 | 461–520 | 0 |
| Akanshi-3 | 401–460 | 0 |
Chandigarh alone reached Uttam-3. Meanwhile, DNH&DD, Punjab, Kerala and Delhi entered Prachesta-1. Lakshadweep, Himachal Pradesh, Goa, Maharashtra and Odisha remained in Prachesta-2.
In contrast, 26 States and Union Territories stayed in either Prachesta-3 or Akanshi-1. Consequently, the national picture shows improvement, but not excellence.
National PGI Dashboard
Table 3: Critical Data Snapshot
| Indicator | Data |
|---|---|
| Highest score | 766.0 |
| Lowest score | 525.7 |
| Score gap | 240.3 |
| Gap in 2025–26 | 31.4% |
| Gap in 2017–18 | 51% |
| Top performer | Chandigarh |
| Lowest performer | Meghalaya |
The report records the maximum score at 766.0 and the minimum score at 525.7, creating a gap of 240.3 points. It also states that this gap has reduced from 51% in 2017–18 to 31.4% in 2025–26.
This reduction shows progress. However, the remaining gap remains too large for a national school system that seeks equal opportunity. As a result, a child’s school experience still depends heavily on the State or Union Territory in which the child studies. Therefore, PGI 2.0 should push governments towards targeted district-level correction.
State-Wise Movement: 2024–25 to 2025–26
Annexure-1 shows that many States and Union Territories improved in 2025–26. However, four recorded score declines.
Table 4: Major Score Movements
| State/UT | Change | Grade Movement |
|---|---|---|
| Lakshadweep | +85.1 | Prachesta-3 ? Prachesta-2 |
| Meghalaya | +77.7 | Akanshi-3 ? Akanshi-1 |
| Bihar | +57.8 | Akanshi-2 ? Akanshi-1 |
| Goa | +51.4 | Prachesta-3 ? Prachesta-2 |
| Telangana | +47.5 | Akanshi-1 ? Prachesta-3 |
| Jammu & Kashmir | +46.8 | Akanshi-2 ? Akanshi-1 |
| Tamil Nadu | +46.0 | Prachesta-3 ? Prachesta-3 |
| Manipur | -9.3 | No grade decline |
| Madhya Pradesh | -7.3 | No grade decline |
| Odisha | -3.7 | No grade decline |
| Uttarakhand | -1.7 | No grade decline |
The movement data shows two trends at the same time. On the one hand, Lakshadweep, Meghalaya, Bihar, Goa and Telangana improved sharply. On the other hand, some States lost score without falling into a lower grade.
Therefore, raw scores matter as much as grade bands. Moreover, policymakers should study why some States improved quickly while others stagnated or slipped.
Domain-Wise Performance: The Main Policy Contradiction
Domain-wise results reveal the core contradiction of PGI 2.0. Access, Equity and Teacher Education & Training show stronger performance. However, Learning Outcomes, Infrastructure and Governance still expose structural weaknesses.
Annexure-2 shows Punjab leading Learning Outcomes with 150.4 out of 240, Kerala and Puducherry leading Access with 73.8 out of 80, Chandigarh leading Infrastructure with 150.11 out of 190, Delhi leading Equity with 245.1 out of 260, Chandigarh leading Governance with 106 out of 130, and Lakshadweep leading Teacher Training with 96.2 out of 100.
Learning Outcomes: The Core Weakness
The report describes Learning Outcomes as “perhaps the most important domain” and the ultimate goal of the index. Yet only one State/UT reached Uttam-3 in this domain. In addition, no State/UT reached Utkarsh, Uttam-1 or Uttam-2.
Table 5: Learning Outcomes Grade Spread
| Grade Group | Count |
|---|---|
| Utkarsh / Uttam-1 / Uttam-2 | 0 |
| Uttam-3 | 1 |
| Prachesta Bands | 20 |
| Akanshi Bands | 15 |
This is the central concern. India has improved access and data systems; however, classroom learning remains weak. The report also states that Learning Outcome scores use PARAKH Rashtriya Sarvekshan 2024, and PGI 2.0 retained these scores for 2025–26.
Consequently, the most important domain does not fully capture fresh 2025–26 learning changes. The index still helps structural diagnosis. At the same time, it cannot replace annual classroom-level diagnostic assessment. Therefore, policymakers should supplement PGI with regular learning checks at the school and district levels.
Access: Stronger, But Not Sufficient
Access performs much better than Learning Outcomes. Kerala and Puducherry reached Utkarsh, while 14 States/UTs reached Uttam-1 and 11 reached Uttam-2.
Although this is encouraging, access success cannot count as final success. Children may enter school and continue to the next class, yet many may still fail to acquire grade-level skills. Therefore, States must move from “children in school” to “children learning at grade level.”
By contrast, Learning Outcomes show no State/UT in Utkarsh, Uttam-1 or Uttam-2. This difference means enrolment and retention indicators perform better than classroom achievement. Hence, the next policy phase must connect access with measurable learning recovery.
Infrastructure and Facilities: Uneven Reform
The Infrastructure & Facilities domain covers toilets, drinking water, clean spaces, electricity, computing devices, internet, libraries, sports resources, ICT facilities and timely textbook availability. Yet no State/UT reached Utkarsh or Uttam-1.
This weakness matters because infrastructure now means more than buildings. It includes digital access, laboratories, libraries, health facilities, water, energy and inclusion-related systems. Consequently, weak infrastructure scores can directly affect digital learning, vocational readiness and school safety.
Moreover, asset creation must connect with classroom use. A smart classroom that remains unused cannot improve learning. Similarly, a library without reading time cannot build comprehension. Therefore, infrastructure policy should measure usage, not only availability.
Equity: Strong Domain, But Needs Caution
Equity appears to be the strongest domain. Chandigarh, Delhi and Tamil Nadu reached Utkarsh, while 30 States/UTs reached Uttam-1.
This is an important achievement. However, equity cannot stand alone as proof of learning success. A State may show low gaps between groups; nevertheless, its absolute learning level may remain modest.
Otherwise, low gaps may hide uniformly weak learning. For example, different student groups may perform similarly, yet all may remain below grade level. Consequently, India needs equity-adjusted learning dashboards that combine inclusion with actual achievement.
Governance Processes: Digital Monitoring Needs Real Action
Governance Processes include IT-based indicators, digital attendance of students and teachers, and the time taken by State governments to release funds. Only Chandigarh reached Uttam-1; no State/UT reached Utkarsh.
Digital attendance and fund-flow monitoring help administration. However, these tools should not become box-ticking indicators. Instead, they should improve teacher availability, school supervision, fund utilisation and student learning.
In addition, governance indicators should trigger time-bound corrective action. If attendance data reveals teacher absence, officials must respond quickly. Likewise, if fund-release delays affect schools, the index should create administrative accountability.
Teacher Education and Training: Stronger Than Learning Outcomes
Teacher Education & Training performs better than Learning Outcomes. Kerala and Lakshadweep reached Utkarsh; six States/UTs reached Uttam-1; and 13 reached Uttam-2.
This creates an important policy question. If teacher qualification and training indicators look stronger than learning outcomes, why do learning results remain weak? The answer may lie in classroom practice, teacher deployment, subject-wise support, student attendance, weak foundational learning and limited academic mentoring.
Hence, teacher policy must move from qualification counting to teaching-quality improvement. In addition, States should link training with classroom observation, lesson planning, mentoring and student assessment outcomes. Otherwise, teacher training may improve official scores without changing classroom practice.
Reform Priorities
Table 6: Critical Policy Dashboard
| Area | Data Signal | Required Action |
|---|---|---|
| Learning | 15 in Akanshi bands | Learning recovery mission |
| Access | Stronger than learning | Shift to grade-level learning |
| Infrastructure | No top two bands | Measure usage, not only assets |
| Equity | 33 in top two bands | Audit absolute learning |
| Governance | No Utkarsh performer | Link data with action |
| Teacher Training | Better than learning | Connect training to classrooms |
This dashboard shows that India’s reform challenge is no longer one-dimensional. Access matters, but learning matters more. Infrastructure matters, but usage matters more. Teacher qualification matters, but classroom impact matters more. Therefore, PGI 2.0 must become a trigger for targeted reforms rather than a yearly statistical exercise.
ABC Live Critical Analysis
PGI 2.0 creates a common language for assessing school systems. It avoids a simple rank race and places States and Union Territories in grade bands. Therefore, it supports long-term improvement rather than annual political competition.
However, the 2025–26 data shows a shift in India’s school education challenge. The country has improved access, equity and data systems, but learning outcomes remain the central weakness. Consequently, the next reform phase must not confuse school attendance with education.
The index also shows that better teacher qualification scores do not automatically produce better learning outcomes. Moreover, compliance reporting cannot replace classroom reform. For this reason, teacher support, diagnostic assessment, foundational literacy, subject-specific mentoring and district-level accountability must become the core of school reform.
Policy Recommendations
1. Launch a Learning Outcomes Recovery Mission
States and Union Territories in Akanshi and Prachesta learning bands should prepare district-level learning recovery plans. In addition, these plans should focus on foundational literacy, mathematics, language comprehension and grade-wise learning gaps. Quarterly targets should guide implementation, so that officials can check progress before the next annual index cycle.
2. Move From Enrolment to Grade-Level Learning
Access indicators are improving, but learning outcomes remain weak. Therefore, every State must measure whether children learn at grade level, not merely whether they remain enrolled. Moreover, school inspections should include simple learning checks, not only infrastructure and attendance verification.
3. Use Infrastructure for Learning
States should measure ICT labs, smart classrooms, libraries and laboratories by use, not only availability. In addition, schools should report how often students use these facilities and whether they improve learning outcomes. Otherwise, infrastructure investment may raise compliance scores without improving education quality.
4. Audit Equity Scores With Learning Scores
Strong equity scores require comparison with actual learning levels. If all groups perform similarly but at low learning levels, equity alone cannot count as success. Therefore, States should publish equity-adjusted learning dashboards.
5. Strengthen Governance Beyond Digital Attendance
Digital attendance, Aadhaar seeding and fund-flow data should support real administrative correction. As a result, they should help reduce vacancies, improve teacher deployment and ensure timely academic support. Similarly, fund-release indicators should connect with school-level outcomes.
6. Link Teacher Training With Classroom Change
Teacher qualification indicators should connect with classroom observation, mentoring, lesson quality and student assessment outcomes. Otherwise, training may improve official scores without changing teaching practice. Consequently, teacher training must become a classroom-performance tool.
How We Verified
ABC Live reviewed the uploaded Performance Grading Index 2.0 for States/UTs 2025–26 report, including its methodology, grade structure, overall State/UT results, domain-wise scores and annexures. The analysis cross-checked overall scores, domain scores and grade movements from the report’s tables and maps. In addition, ABC Live checked release-context reporting for the Ministry’s release of PGI 2.0 and UDISE+ 2025–26.
Sources and Resources
Official Sources
- Performance Grading Index Portal – UDISE+
- UDISE+ Official Portal
- PARAKH, NCERT
- National Education Policy 2020 – Ministry of Education
- PM POSHAN Scheme
- PRABANDH Portal – Samagra Shiksha
- Vidyanjali Portal
- Press Information Bureau – PIB
Release Context Sources
ABC Live Internal Links
Final Conclusion
PGI 2.0 for States and UTs 2025–26 gives India a clearer picture of school education performance. It shows progress in access, equity and teacher-related indicators. However, it also shows that actual learning outcomes remain the core challenge.
Therefore, readers should not treat the report as a success certificate. Instead, they should treat it as a reform agenda. India has built better education data systems, but now it must convert that data into classroom-level change. Unless learning outcomes improve sharply, the promise of the National Education Policy 2020 will remain only partly fulfilled.
ABC Live — Making Complex Public Issues Simple.